Wednesday, February 22, 2012

Study Tip #1 - Confirm answers using a calculator

This is probably a very common sense thought, but sometimes we find ourself with a question in particular that is so easy we do not need a calculator.  

Do not fall for this!  Double check your assumptions with your calculator.  

Remember: That 1 incorrect answer may be the difference between pass or fail.


Thursday, February 2, 2012

Profitability Ratios #2: Profit Margin (Gross & Net)


Profit Margin

Measures the profit genereted from sales (per £ of sales)


The Formula


Depending on what information you have available to you will determine how you calculate the top line of the equation.

Gross profit can be:

EBIT + Admin Expenses
Operating Profit + Admin Expenses
Turnover – Cost of Sales
Gross Profit


Net Profit can be:

Gross Profit – Admin Expenses
EBIT
Operating Profit
Net Profit


Example

Balance Sheet

Turnover
200m
Cost of Sales
157m
Gross Profit
70m

Administration expenses
20m
Operating Profit (Earnings before interest and taxes)
50m


Solution


Gross Profit Margin


Net Profit Margin


Wednesday, February 1, 2012

Profitability Ratios #2: Asset Turnover


Asset Turnover

The measure of how efficiently the company's assets are working. 


Formula


Example


Balance Sheet

Sales or Turnover
230,000

Fixed Assets
100,000

Current Assets
50,000

Current Liabilities (under 1 year)
25,000


Solution


Tuesday, January 31, 2012

Profitability Ratios #1: Return On Capital Employed

Some basic ratios to give an indication of profitability for companies you may be interested in for investment purposes.  Today we will begin with:


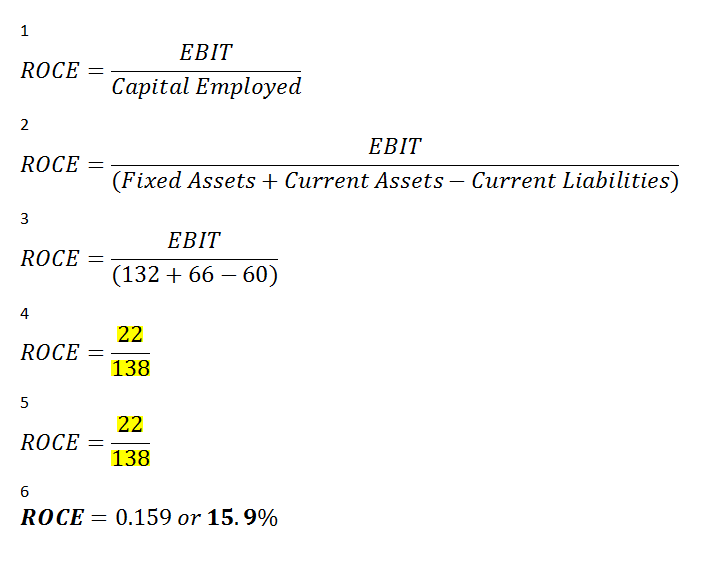
Return On Capital Employed

ROCE is the measure of the company's profitability from the capital used.  Or, income generated as a percentage of it's total capital.


The Formula


EBIT = Earnings Before Interest and Tax (or Operating Profit)

Capital Employed = Total Assets - Current Liabilities
or
Capital Employed = Shareholder Equity + Current Liabilities


Example

Using the balance sheet below, we will use both methods of 'capital employed' and EBIT to work out the Return On Capital Employed:
Source: Corporate Finance and Investment: Decisions and Strategies (5th Edition) p49, Richard Pike & Bill Neale

Example 1


Example 2


Elearn, click here 

Friday, January 27, 2012

Running Yield!

This is the simplest and quickest way calculate the return.  
However, it does not take into account the cost of the bond or the maturity date.
 
The Formula


Example

UK Treasury Stock 7% 2021
Can be bought at 102.2 as @ Jan 2013


UK Open Learning Click Here!

Thursday, January 26, 2012

Gross Redemption Yield!


Calculating the GRY of a bond is really easy!  At first glance of the formula, it may appear difficult.  Especially when you need to remember it!

We are basically finding out the following:

Total income up until maturity
The cost of the bond/gilt

Using this information together with the maturity date, we are able to calculate the approximate yield against the current cost from this bond, before we decide to purchase.

The Formula
In a few texts the formula is over complicated, where you are expected to calculate the running yield first.   We don't have to:


Example

So, let's take the following bond/Gilt:

UK Treasury Stock 7% 2021
Can be bought at 102.2 as @ Jan 2013

What do we know about this?

Coupon = 7% or 0.07
Maturity Date = 2021 (so years to maturity from 2013 is 8 years)
Par Value = typically 100 in the UK or 1000 in the US
Market Price = 102.2

Using the formula above we can calculate the GRY, remember to calculate the brackets first:


UK Open Learning Click Here!

Wednesday, January 25, 2012

Bond Strategies!

My goal today is to remember and understand the following:

Active Bond Strategies

Anomaly Switching

Switching between two similar bonds from the most expensive to the cheapest.  The analyst will be looking at the coupon rate and price of the bond.  The Gross Redemption Yield could be used to calculate an anomaly, but I expect the analysis goes much deeper.


Policy Switching

Switching between similar bonds where the duration/maturity date is from high to low and vice versa.  This strategy would be used when the interest rate is speculated to be suddenly lowered, or raised. 


Intermarket Spread Switch 

When the difference of yield between the Gilt and Corporate Bond market instruments are of better value, the holder will switch from one to the other effectively switching markets.  Remembering that Corporate Bonds are considered more risky than Gilts, an event may occur which will alter the risk appetite of investors.  The investors may favour the riskier instrument and switch over, if the yields are right.


Passive Bond Strategies

Immunisation


Basically means the bond portfolio is immune to future interest rate fluctuations.  Immunisation can be performed by the following strategies:


Duration-Based


Purchasing a bond at a price and maturity which matches the Present Value of the liability.  


Cash Matching


When the redemption payment and coupon cashflows meet the cash liabilities which are required to be met by the business.  This would be one of the most basic operations in a treasury department within a small company if they were holding Bonds purely to manage expected cashflows. 

UK Open Learning Click Here!